
Key Metrics Demand Gen Leaders Use to Prove ROI
Demand generation leaders face constant pressure to show measurable business impact. Every campaign and program must prove it contributes to revenue growth and pipeline efficiency. Leadership expects data, not assumptions. Accurate measurement is essential for credibility and budget justification.
Clear ROI metrics allow leaders to identify what works, eliminate wasted spend, and align closely with revenue goals. The ability to quantify performance also strengthens collaboration with sales and finance, turning marketing from a cost center into a measurable driver of growth. The key to delivering that proof lies in tracking the right ROI metrics that connect marketing efforts to financial outcomes.
Quick Takeaways
- Demand gen leaders use ROI metrics to link marketing activity to sales and revenue.
- Lead quality, pipeline contribution, and conversion efficiency are top priorities.
- Accurate attribution builds credibility with sales and finance teams.
- Continuous tracking and optimization strengthen long-term ROI.
1. Lead Quality and Conversion Rates
Strong ROI begins with high-quality leads that convert. Demand generation leaders focus on metrics that measure how effectively marketing drives qualified opportunities.
- MQL to SQL Conversion Rate: Evaluates how many marketing-qualified leads become sales-qualified leads.
- Opportunity-to-Close Ratio: Reflects the success rate of converting opportunities into deals.
- Average Deal Size: Shows whether marketing is attracting high-value prospects.
Tracking conversion efficiency helps identify which campaigns attract serious buyers and which need refinement.
2. Cost Efficiency and Marketing ROI
ROI always ties back to spend. Leaders must understand whether marketing dollars generate sufficient return.
- Cost per Lead (CPL): Measures total spend divided by the number of leads.
- Cost per Opportunity (CPO): A more advanced view of cost-effectiveness.
- Marketing ROI Formula:
ROI = (Revenue Attributed to Marketing − Marketing Investment) ÷ Marketing Investment × 100

Consistent calculation periods help leaders compare programs over time and across channels. Reviewing these cost-based metrics supports smarter budget allocation decisions.
3. Pipeline Contribution and Attribution
Executive teams want clear visibility into how marketing contributes to pipeline and revenue. These metrics show marketing’s direct influence on the sales process.
- Marketing-Sourced Pipeline: Opportunities created directly by marketing efforts.
- Marketing-Influenced Pipeline: Opportunities that marketing helped advance through engagement or nurture.
- Attribution Modeling: Multi-touch attribution clarifies which channels play the biggest role in conversions.
When pipeline attribution is accurate, decision-makers can see how marketing drives measurable financial outcomes.
4. Customer Acquisition and Lifetime Value
Sustainable ROI depends on long-term customer value. Measuring acquisition and retention helps demand gen leaders prove that marketing investments pay off over time.
- Customer Acquisition Cost (CAC): The total spend to secure a new customer.
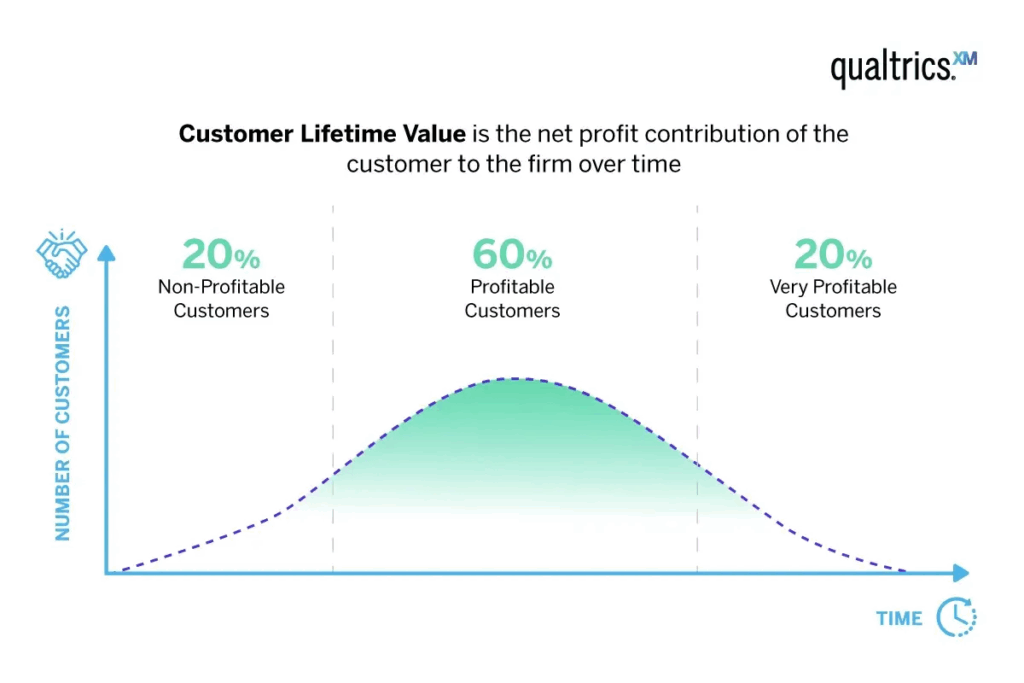
- Customer Lifetime Value (CLV): The total revenue expected from a customer relationship.
- CAC-to-CLV Ratio: Evaluates profitability and efficiency in customer acquisition.
These insights help leaders balance growth with cost control and demonstrate how marketing contributes to lifetime revenue generation.
5. Channel and Campaign Performance
Each channel performs differently. Understanding which channels deliver the strongest ROI allows for precise optimization.
Key metrics include:
- Email Engagement: Open and click-through rates tied to downstream conversions.
- Paid Search ROI: Revenue generated relative to ad spend.
- Content Performance: Form fills, demo requests, or downloads attributed to content assets.
- Event ROI: Opportunities sourced from webinars, conferences, or live events.
Consistent channel-level tracking enables marketing teams to refine strategies and direct budget toward high-performing initiatives.
6. Sales Alignment and Revenue Velocity
ROI grows when marketing and sales move in sync. Velocity metrics show how effectively leads move through the funnel once marketing hands them off.
- Sales Cycle Length: Measures how quickly leads move from opportunity to close.
- Lead Response Time: The average time from MQL creation to first sales contact.
- Follow-Up Rate: The percentage of leads that receive timely engagement.
Faster cycles and consistent follow-up demonstrate strong alignment between sales and marketing teams.
7. Data Accuracy and Reporting Transparency
Accurate data makes ROI measurable. Without clean records and consistent tracking, insights lose credibility.
Metrics that indicate data health include:
- Data Accuracy Rate: The percentage of complete and up-to-date CRM records.
- Attribution Confidence: The level of certainty around lead and opportunity sources.
- Dashboard Adoption: The percentage of stakeholders actively reviewing shared performance data.
Reliable data ensures marketing ROI reports stand up under executive scrutiny.
8. Predictive Insights and Optimization
The best demand generation leaders use ROI metrics to improve performance, not just report on it.
- A/B Test Results: Comparison of campaign versions to identify what drives conversions.
- Predictive ROI Modeling: Uses historical data to forecast results of future initiatives.
- Budget Efficiency: Tracks how reallocating spend improves outcomes across campaigns.
Ongoing analysis creates a cycle of improvement that compounds ROI growth over time.
9. Executive Reporting and ROI Storytelling
Metrics alone don’t prove ROI—clarity and presentation do. Demand gen leaders must translate performance data into language that resonates with executive audiences.
When reporting ROI:
- Start with organizational goals and link marketing results directly to those objectives.
- Highlight pipeline contribution, revenue impact, and payback period.
- Present improvements in velocity, lead quality, and conversion efficiency.
- End with next steps, budgets, and forecasted outcomes.
A concise, visually clear report builds confidence and positions marketing as a strategic partner.
Measure, Align, and Improve Today with Televerde
Demand gen leaders prove ROI by tracking the metrics that connect marketing investment to revenue performance. Lead quality, conversion efficiency, and cost control provide the foundation. Pipeline attribution, velocity, and customer value deepen that understanding.
When data accuracy, collaboration, and consistent reporting guide decision-making, marketing becomes a measurable growth engine. The result is greater accountability, stronger alignment with sales, and a clear path toward higher ROI.
Ready to measure marketing success with precision? Discover how Televerde helps demand generation leaders track ROI, optimize performance, and prove marketing’s contribution to revenue growth. Schedule a consultation today.