
8 Help Desk Metrics to Supercharge Customer Support
Your help desk metrics indicate how well your inbound customer support is performing. They allow you to track and monitor whether you are meeting your goals. Without measuring your performance, you won’t know where you can improve or how satisfied your customers are, which can hurt your sales.
Learn eight key metrics you should track in your customer support center to ensure you are maximizing your resources and offering the best customer experience.
Key Takeaways:
- Help desk metrics help you monitor the daily and weekly productivity of your teams
- Measuring how quickly and efficiently your agents respond to issues directly reflects your customer satisfaction rate.
- Customers spend more on brands that offer an excellent customer support experience.
Why Do You Need Help Desk Metrics?
Your help desk is responsible for resolving customer issues quickly and efficiently. This department does this through phone calls, chat, email, or a combination of several methods. Efficiently resolving issues improves the customer experience, which is a priority for over 45% of businesses.
Help desk metrics are the small-scale indicators of how your customer support is performing. While you might have overarching goals, benchmarks, and KPIs for help desks, you can’t only rely on those to track your performance day-to-day. Those benchmarks only tell you how well you performed within a specified time, like over a year or quarter.
However, your service desk metrics allow you to track your daily or weekly performance for a more immediate understanding of your productivity and customer experience. This allows you to respond faster when issues arise and consistently hit your goals.
Help desk metrics provide essential information about your staff and customers, including:
- Customer satisfaction
- Customer support efficiency
- Employee productivity
- Needed technological updates
8 Metrics You Should Track to Boost Your Sales Growth
Track these eight metrics to understand your help center’s performance better and provide better customer care, which leads to more sales.
1. Number of Conversations
Your conversations are the interactions you have with customers. These might be several conversations with one customer or multiple new conversations.
Tracking this metric is vital for understanding your workplace productivity as it tells you how many conversations your help desk has each hour and day. You can also monitor the peak times for customer interactions to help you better staff your help desk and ensure there is always an available team member to address customer concerns.
2. Resolution Time
Your resolution time is how long it takes an agent to solve each customer’s problem. This is the time between their first interaction and solution.
For instance, you might notice most of your tickets take several interactions to resolve or take over an hour each time. In that case, you would need to offer more training for your agents to handle situations better and speed up their resolution time and your center’s efficiency.
3. First Contact Resolution
Your ultimate goal is to resolve as many tickets as possible on the first interaction. To find your first contact resolution rate, divide the number of first contact resolutions by your total tickets.
For example, if you resolved 80 tickets on the first interaction and had 100 total tickets, your first contact resolution rate would be 0.8 or 80%. The industry standard for a first contact resolution is between 65% and 75%.
First contact resolution leads to happier customers and more positive online reviews, boosting your sales.
4. Response Time
Your response time is the time between when the customer submits a request and when you respond. This might be when they send a chat message, email, or dial the help desk phone number.
Your ideal response time will vary depending on the platform you are using to interact with the customer. For example, an hour response time for an email is a good benchmark. However, if you left your customer on hold on the phone for an hour, that would not be a good response time.
On average, you should aim to respond to emails within an hour, live chat within 48 seconds, and phone calls within 20 seconds.
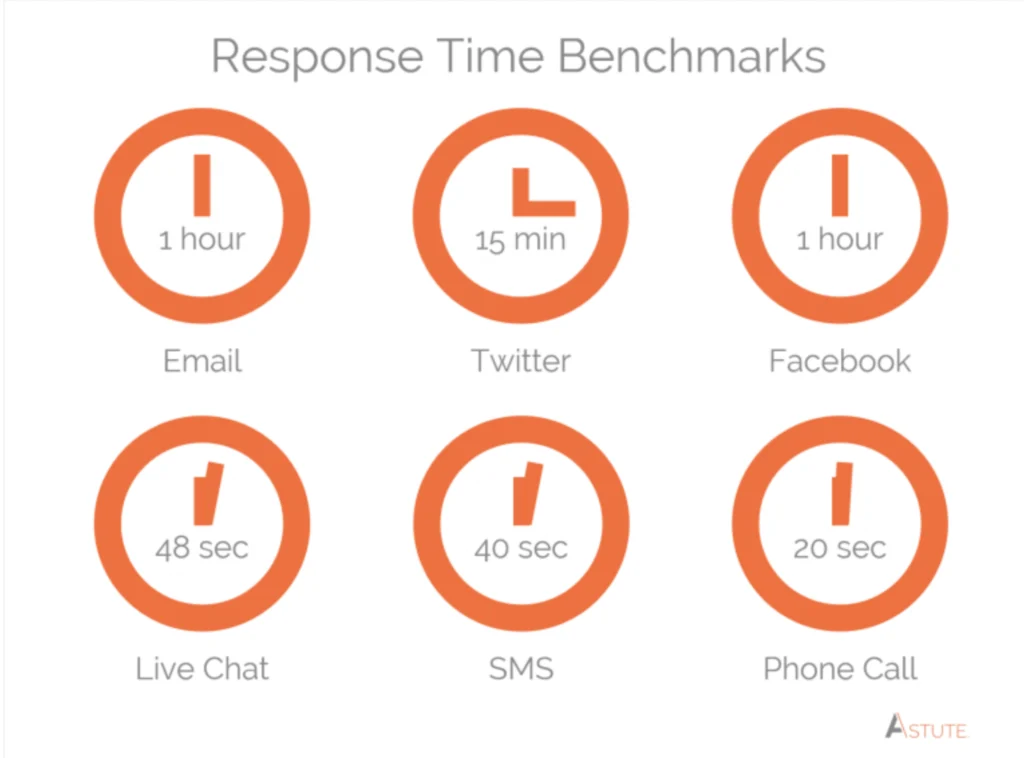
Image from Emplifi
5. Completed Tasks vs. Opened Tasks
Your completed task rate is how many customer tickets you resolve compared to how many new tickets customers open. You want to resolve tickets at the same rate or faster than new tickets arrive for maximum help desk efficiency.
If your team can’t keep up with the new tickets, you will create a backlog of customer inquiries. This backlog will, in turn, delay your resolution speed and negatively impact your customer satisfaction since new customers will need to wait longer to hear back from a team member.
By regularly comparing your incoming tickets to resolved tasks, you can stay on top of backlogs before they occur and move around your staff to ensure you cover all departments and provide timely responses.
6. Ticket Volume
Your total ticket volume is the number of tickets you handle within a specified period. Help centers often look at your ticket volume per hour or day. If your ticket volume is increasing, you should act accordingly to speed up your processes or hire new help center agents to prevent a backlog or unnecessary delays.
Be sure to track your ticket volume for specific departments, as this can help pinpoint where ticket issues are most common.
If you’re getting too many tickets than your team can handle, consider other ways to help customers, like FAQ pages or automated support.
7. Customer Satisfaction Rate
Your customer satisfaction rate is what percentage of your customers were pleased with the help they received compared to the total number of customers. You can find your customer satisfaction rate by asking for feedback at the end of each interaction.
Over 86% of customers will spend more on a brand that offers a positive customer experience.
To make this metric more valuable, consider asking for specific examples of what they liked or didn’t like to help you improve future interactions. However, if you make the survey too long, fewer customers will be willing to fill it out.
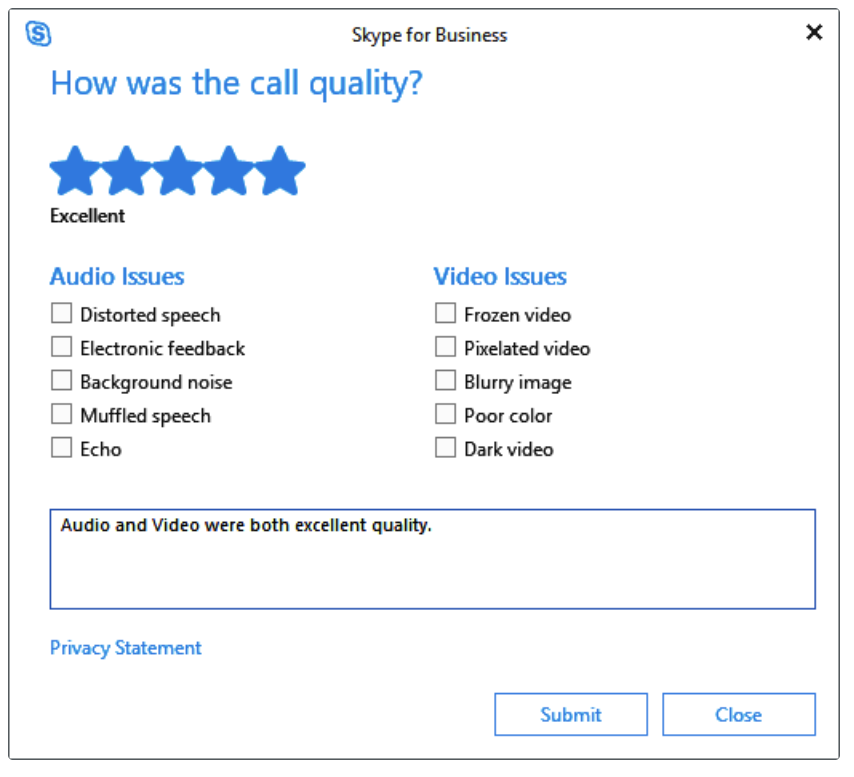
Image from HubSpot
8. Transfer Rate
When customers call or reach out to a company, they prefer to reach the correct department on their first attempt. No one likes customer service reps passing them from department to department before receiving an answer to a simple question.
Tracking how often you transfer a customer to a different department can help you identify an issue with how you present your contact information to customers.
Improve Your Inbound Customer Support
Televerde helps you deliver better care by improving your first call resolution rate, customer satisfaction, and your call volume.
Contact us to learn more about our customer care solutions.